Dashboards are nice tools when it comes to analyzing quickly changing data. Nevertheless,
you may also use them for reporting purposes by taking snapshots. R has a nice library
called flexdashboard which you can use for creating dashboards out of RMarkdown files.
During a project at work we found a nice solution for dynamically rendering flexdashboard pages
by using R Markdown child templates which I want to share with you in this blog post.
In our project we wanted to dynamically create a dashboard-style report. It should automatically fetch data by the use of parameters which are specified and passed to the knitting function. This can easily be solved by using RMarkdown parameters. An additional problem we had though, was that we wanted the report to have an overview page with important information but also subpages with dynamically knitted detail analysis. The subpages should all have the same format but their number would be depending on the fetched data (i.e. number of different subgroups).
Example Use Case
Let’s go through the problem and our approach with a made up example:
Imagine we want to analyse the performance of a company’s products. We plan to have an
overview page where we show summarized information about all products of the company.
This could for example be:
- Trade volume by time
- Product groups’ share on company’s trade volume and order count
- …
The recipient of the report also wants a deeper analysis of each product group in order to gain more detailed information. Therefore, we plan to create subpages within our report which show information like:
- Trade volumes share of products within their product group
- Products with most trade volume
- …
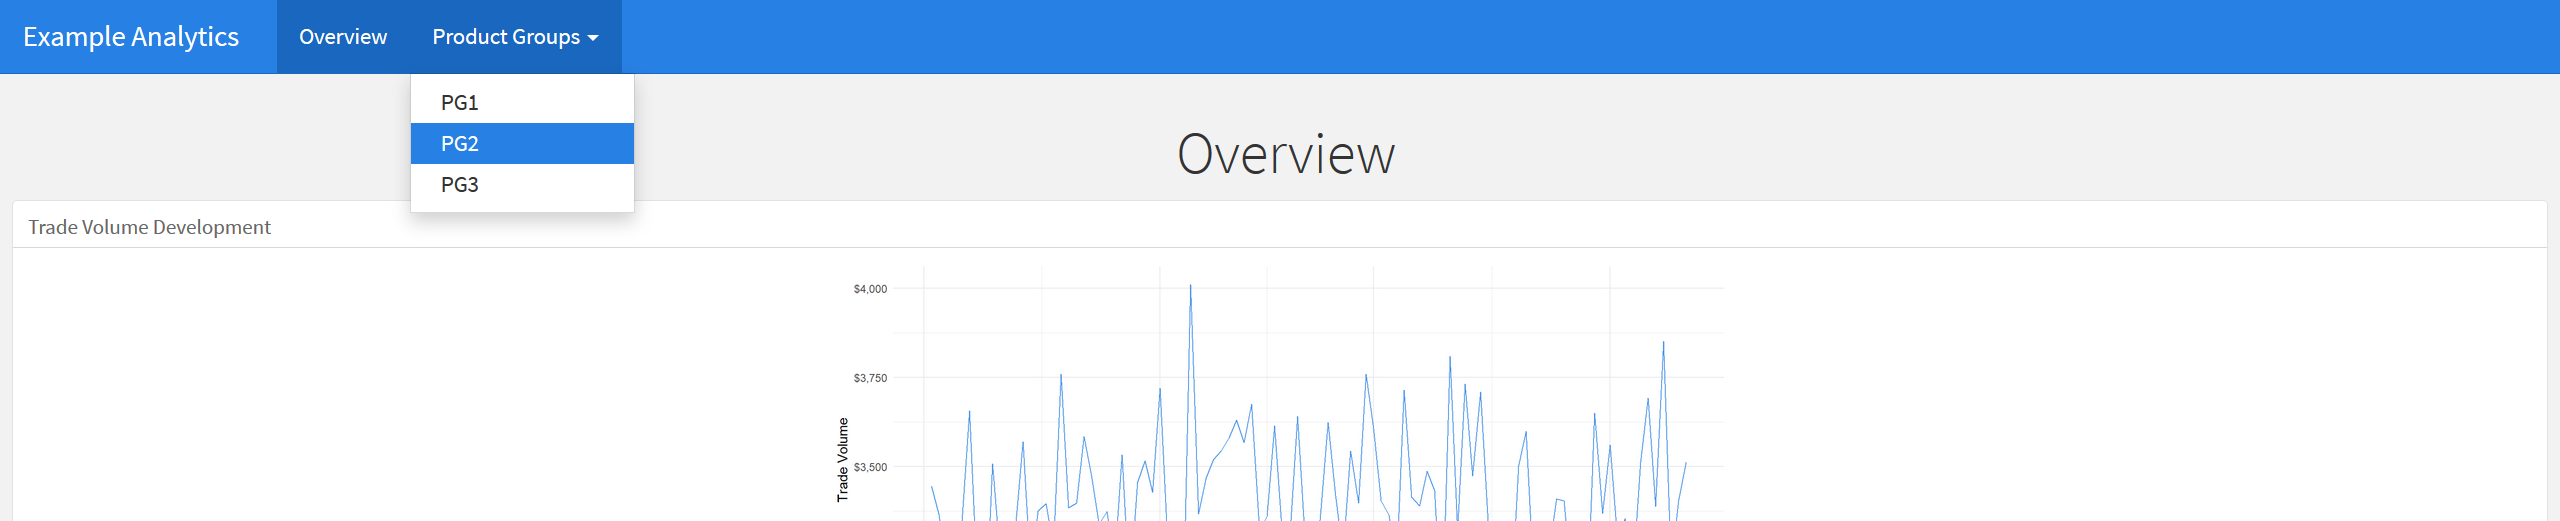
The following gif shows how the report could look like. It is probably not the most sophisticated and beautiful report you have ever seen but it should be OK for example purposes:
While each subpage should have the exact same format, the count of pages will depend on the data
(i.e. the product groups) we fetch for a specific company.
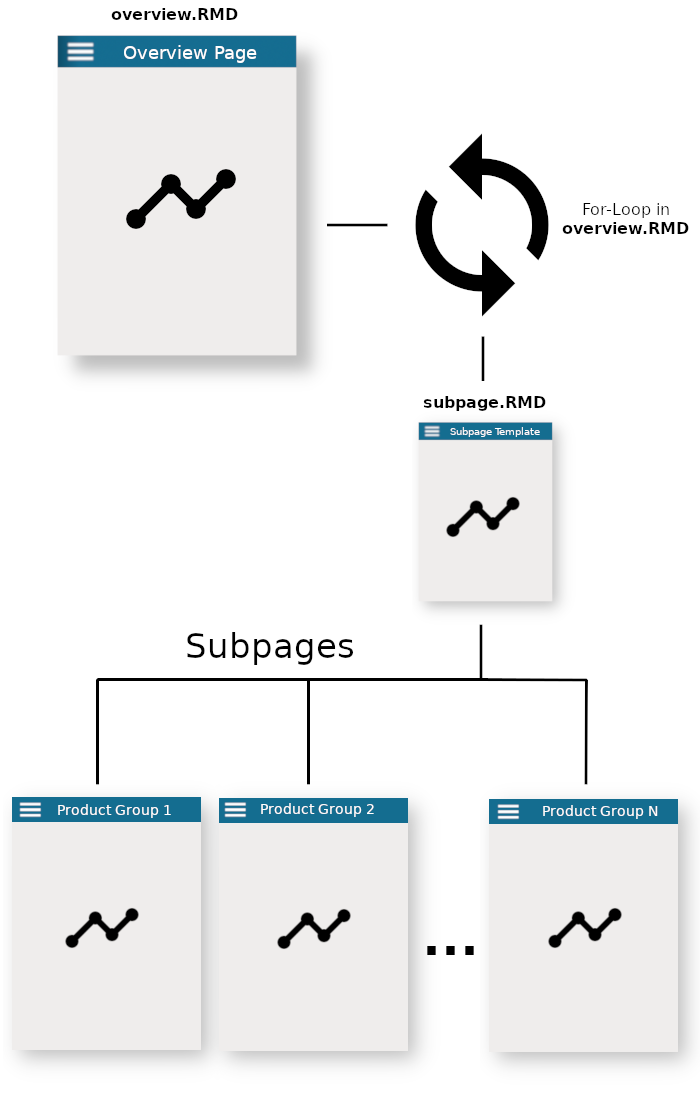
The approach we show in this post is to use a overview.RMD file which has all the code for the
overview page and a subpage.RMD file which should serve as a template for the subpages.
We then want to somehow render the subpage for each product group in the data (i.e.
by using a for-loop within overview.RMD) and integrate all these pages into one report.
The following diagram should give you an abstract idea of the process we plan to implement:
Let’s do it!
We will go through our approach step by step and I am going to show you the important code
chunks you need.
The following list will give you an overview on the issues we need to master
in order to integrate the subpage template into overview.RMD:
- Dynamically create page name for each product group and add it to a navbar menu
- Dynamically create page content for given product group
Product Groups - Combine knitted content of all subpages and add it to bottom of
overview.RMD
Preparations
Before we tackle those issues, we need to find all unique product groups we want to create the
subpages for, and initialize a out variable which stores all content knitted within our loop.
Additionally, we need to change the knitr options to allow duplicated chunk labels.
Otherwise we cannot loop through subpage.RMD anymore if we would use the same chunk labels.
# Get all unique product groups for the subpages
product_groups <- unique(data$product_group)

# Create variable which stores all subpages outputs
out = NULL

# Set knitr options to allow duplicate labels (needed for the subpages)
options(knitr.duplicate.label = 'allow')
The first trick we use for our subpage rendering is the creation of a separate environment
which stores the data needed in subpage.RMD (i.e. the filtered data). We create this
environment and call it subpage_env.
# Create temporary environment which we use for knitting subpage.RMD
subpage_env <- new.env()Filter Data and Knit Subpage
Now everything is prepared and we can loop through each product group, filter the data
accordingly, assign the corresponding variables to subpage_env and knit the page using
our subpage environment. The knitted result will be added to our out variable.
for (pg in product_groups) {
  # Filter data for product group
  subpage_data <- data %>%
    filter(product_group == pg)

  # Assign filtered data and product group to subpage_env
  assign("subpage_data", subpage_data, subpage_env)
  assign("product_group", pg, subpage_env)

  # Knit subpage.RMD using the subpage_env and add result to out vector
  out = c(out, knitr::knit_child('subpage.RMD', envir = subpage_env))
}
This is basically it. Let me know what you think of our approach or if you have any improvement
ideas on it. You might also want to have a closer look into the example files overview.RMD
and subpage.RMD which you find at the bottom of this post.
Find a demo of the dashboard we created in this post here
Further Reading
I suggest going to the documentation of flexdashboard if you want to learn more about
the package. Furthermore, I want to provide you with some additional links which helped me evolving
the idea.
Update 2020-04-01
Corrected a typo in the markdown which broke the menu generation. Thanks to Chris Brown for pointing that out.
Markdown Files
Overview.RMD
---
title: "Example Analytics"
output:
  flexdashboard::flex_dashboard:
    orientation: rows
    vertical_layout: fill
---
# Overview

`r shiny::tags$h1("Overview", style="text-align:center")`

```{r setup, include=FALSE}
library(flexdashboard)
library(tidyverse)

# Create dummy data for example
set.seed(345)
date_start <- as.Date("2018-01-01")
product_groups <- c("PG1", "PG2", "PG3")
products <- list(
  PG1 = c("A", "B", "C"),
  PG2 = c("D", "E", "F"),
  PG3 = c("G", "H")
)
data <- data.frame(
  product_group = sample(product_groups, 100, replace = T),
  trade_volume = rnorm(100, mean = 3448, sd = 200),
  date = date_start + 1:100
) %>%
  group_by(id = row_number()) %>%
  mutate(product = sample(unlist(products[[product_group]]), 1, replace = TRUE)) %>%
  ungroup()
```


Row
-----------------------------------------------------------------------

### Trade Volume Development

```{r fig.width=15, fig.height=5}
data %>%
  group_by(date) %>%
  summarise(trade_volume = sum(trade_volume)) %>%
  ggplot() +
  geom_line(aes(x = date, y = trade_volume),
           color = "#2780e3",
           alpha = 0.8) +
  scale_y_continuous(labels = scales::dollar) +
  theme_minimal() +
  ylab("Trade Volume") +
  xlab("Date")
```


Row
-----------------------------------------------------------------------

### Product Group Share on Trade Volume

```{r}
data %>%
  group_by(product_group) %>%
  summarise(trade_volume = sum(trade_volume)) %>%
  mutate(trade_volume_share = trade_volume / sum(trade_volume)) %>%
  ggplot() +
  geom_col(aes(x = reorder(product_group, -trade_volume_share), y = trade_volume_share),
           fill = "#2780e3",
           alpha = 0.8) +
  scale_y_continuous(labels = scales::percent) +
  theme_minimal() +
  ylab("Share on Trade Volume") +
  xlab("Product Group")
```

### Product Group Share on Order Count

```{r}
data %>%
  group_by(product_group) %>%
  summarise(order_count = n()) %>%
  mutate(order_count_share = order_count / sum(order_count)) %>%
  ggplot() +
  geom_col(aes(x = reorder(product_group, -order_count_share), y = order_count_share),
           fill = "#2780e3",
           alpha = 0.8) +
  scale_y_continuous(labels = scales::percent) +
  theme_minimal() +
  ylab("Share on Order Count") +
  xlab("Product Group")
```

```{r render subpages, include=FALSE}
# Get all unique product groups for the subpages
product_groups <- unique(data$product_group)

# Create variable which stores all subpages outputs
out = NULL

# Set knitr options to allow duplicate labels (needed for the subpages)
options(knitr.duplicate.label = 'allow')

# Create temporary environment which we use for knitting subpages.RMD
subpage_env <- new.env()

for (pg in product_groups) {
  # Filter data for product group
  subpage_data <- data %>%
    filter(product_group == pg)

  # Assign filtered data and product group to subpage_env
  assign("subpage_data", subpage_data, subpage_env)
  assign("product_group", pg, subpage_env)

  # Knit subpage.RMD using the subpage_env and add result to out vector
  out = c(out, knitr::knit_child('subpage.RMD', envir = subpage_env))
}
```

`r paste(knitr::knit_child(text = out), collapse = '')`
Subpage.RMD
`r paste0('# ', product_group, '{data-navmenu="Product Groups"}')`
`r shiny::tags$h1(product_group, style="text-align:center")`
Row
-----------------------------------------------------------------------
### Product Share on Trade Volume
```{r fig.width=10}
subpage_data %>%
group_by(product) %>%
summarise(trade_volume = sum(trade_volume)) %>%
ggplot() +
geom_col(aes(x = reorder(product, -trade_volume), y = trade_volume),
fill = "#2780e3",
alpha = 0.8) +
scale_y_continuous(labels = scales::dollar) +
theme_minimal() +
ylab("Trade Volume") +
xlab("Product")
```
### Products with Most Trade Volume
```{r}
subpage_data %>%
group_by(Product = product) %>%
summarise(`Trade Volume [â¬]` = sum(trade_volume)) %>%
arrange(-`Trade Volume [â¬]`) %>%
knitr::kable()
```